
How many times, while working on Power Platform, have you found yourself having to mentally reconstruct complex processes? From today there is a new feature that radically changes the approach to planning.
One of the most interesting innovations within the Power Apps tool is undoubtedly the Process Maps functionality, which allows you to visualize and understand process flows directly within the planning phase of a solution.
“Over the past year, I have worked on several challenging projects developed on the Power Platform. One major limitation I have always recognized in these tools is the lack of a business/application process map that provides both a micro and macro vision, depending on the needs. In the best-case scenario, I end up with an application supported by a few workflows exchanging data (read and write), but as things become more complex, having a process diagram—including events, activities, user roles, etc.—becomes ESSENTIAL.”
Advantages
We’re not just talking about diagrams, there’s much more:
- Improved decision-making: visualizing processes helps to identify bottlenecks, redundancies and dependencies early on, allowing for smarter allocation of resources.
- Enhanced communication: both business and IT teams can align on the same visual representation, reducing misunderstandings and speeding up approvals.
- Risk reduction: Mapping decision points and user roles from the outset minimizes surprises during implementation and ensures compliance with organizational policies.
In short, process maps transform planning from a static document into a dynamic project for success. (source: Microsoft)
How to enable it
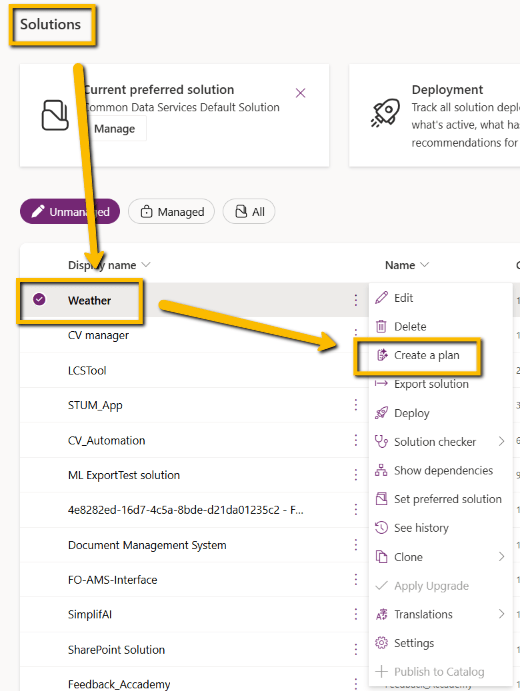
First of all, you need a solution containing tables, automations, applications and everything else that needs to be analysed.
Select the solution and click on “Create a plan”
At this point a popup appears where you enter your requirements.
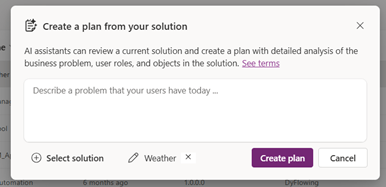
“Analyse the entire solution and report any issues or bugs.
Recommend any improvements for each element of the solution.
Weather is a solution that retrieves weather data from the web and saves it to a dataverse table. The data will be available for creating a Power BI report. The app also provides real-time data access.”
The solution is automatically analyzed by AI using a wizard. This is part of the analysis and map creation process. A modifiable output is provided, and the wizard guides the process step by step through each element:
- Business problem
- Purpose of this plan
- User processes
- Data model
- Technology
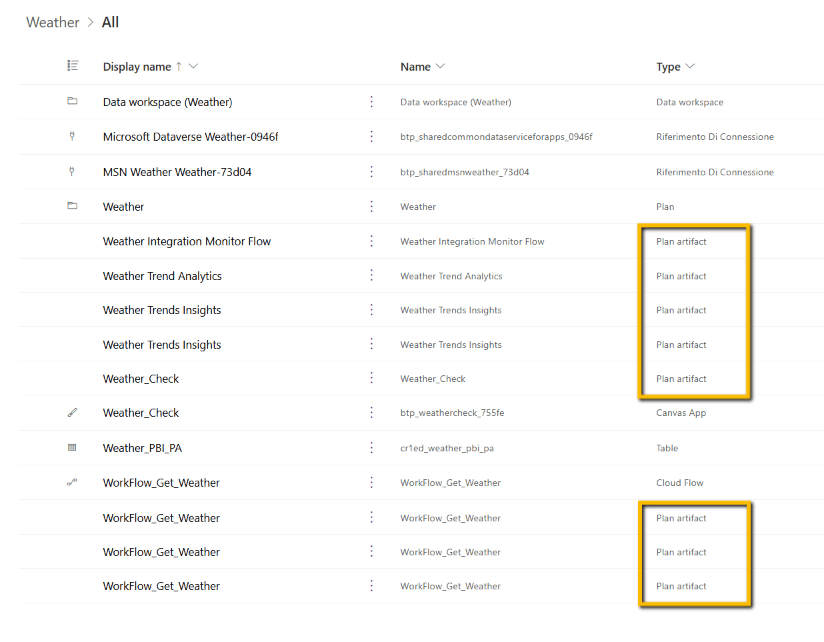
This is the result!
Note that this solution only collects weather forecasts and saves them to a SharePoint table. Imagine the potential for a much more complex project.
The Plan can be saved within the same solution. This process creates other elements called “Artifacts” , which are nothing more than objects comprising the Plan itself.
Why use it or at least try it
Greater clarity and understanding of the process
Process Maps make it possible to visualize the entire workflow clearly, including activities, events and decisions. This helps technical and business teams to easily align on how the process works, reducing misunderstandings and ambiguity.
More effective collaboration between stakeholders
The visual representation makes it easier to discuss, share and validate the process with all parties involved. This speeds up approvals, reviews and decisions during the solution design phase.
Reduced risks and improved project quality
Mapping out activities and decision points in advance allows you to identify bottlenecks, dependencies or potential issues before development. The AI also helps to keep the model consistent during changes and updates.
Would you like to see how this functionality can be adapted to your organization’s processes? We can analyze them together.
Boom, done 💣!
Follow me:

Leave a comment